Chile Shopify Market Analysis - 3.0K Stores
Complete Chile Shopify market analysis: 3.0K stores, $33.8M revenue. Top categories, technology insights, and growth opportunities for CL ecommerce.
Key Market Statistics
3K
Active stores in our database
$34M
Annual revenue
6M
Monthly visits
$9K
Per store annually
Chile Shopify Market Overview
Chile Ecommerce Market Analysis
Top Product Categories in Chile
Top Product Categories
62.0%
Ecommerce Platforms
104 stores
3.5%
3.2%
2.6%
2.3%
2.3%
2.1%
1.9%
1.7%
1.6%
1.6%
1.3%
1.3%
1.1%
1.0%
0.9%
0.9%
0.8%
0.8%
0.8%
0.8%
0.8%
0.6%
0.5%
0.4%
0.4%
0.3%
0.3%
0.2%
0.2%
0.2%
Wedding Planning
5 stores
0.2%
0.1%
0.1%
0.1%
0.1%
Design Tools
3 stores
0.1%
0.1%
Fitness Trackers
3 stores
0.1%
0.1%
0.1%
0.1%
0.1%
0.1%
Business Consulting
1 stores
0.0%
0.0%
Technology Stack Analysis for Chile
Widgets Apps
eCommerce Apps
Payment Apps
SEO Performance in Chile
SEO Performance Metrics
Key Takeaways for Chile Shopify Market
Trending Products for Ecommerce in Chile
Finding trending products is a key step for entering the Chile ecommerce market. These products are gaining popularity based on Amazon & Google Trends data.

Womens V Neck Long Sleeve Shirt Fall Fashion Tops Tunic Dressy Casual Sweater Clothes Cute Trendy Work Outfits 2026
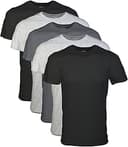
Men's Crew T-Shirts, Multipack, Style G1100

Women's Square Neck Ruffle Hem Mini Dress Ruched Waist Long Sleeve Corset Short Party Dresses

Hoewina Dog & Cat Bed for Indoor Cats, 20in Calming Donut Bed for Puppy and Kitten, Washable Round Fluffy Pet Bed for Small Medium Dogs and Cats (Light Grey)
Ready to explore the Chile market?
Get detailed insights and discover opportunities in the Chile ecommerce landscape.


Stop guessing and start
seeing real store data in one click
🍯 New Investigation: PayPal Honey Report
Exclusive analysis of 173,871 stores affected by PayPal Honey's affiliate practices. Search our complete database.
Read the Full Exposé →Browse All Chile Shopify Stores
Explore 3K verified stores from Chile. Filter by category, industry, revenue, and more.