Best Selling Products
 #1
#1Products
$12.00
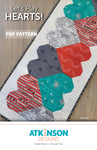 #2
#2Let's Play Hearts PDF Pattern
$12.00
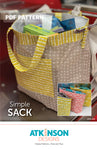 #3
#3Simple Sack PDF Pattern
$12.00
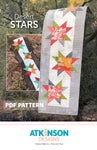 #4
#4Desert Stars Table Runner PDF Pattern
$12.00
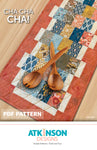 #5
#5Cha Cha Cha PDF Pattern
$12.00
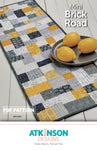
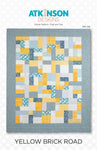 #6
#6Yellow Brick Road Pattern
$12.00
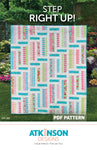 #7
#7Step Right Up PDF Pattern
$12.00
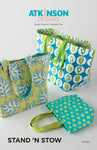 #8
#8Stand 'N Stow Pattern
$12.00
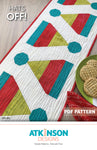 #9
#9Hats Off! PDF Pattern
$7.50
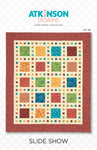 #10
#10Slide Show Pattern
$12.00
Showing top 10 of 48 best sellers
Range: $2 - $26
Rating Breakdown
Very low revenue (<$5K/month). No growth data available. Very low AOV (<$20).
Minimal traffic (<50K visits/year). No traffic growth data available. Good conversion rate (2-3%).
Dropshipping detected (penalty: -5 points). Unknown category.
No Trustpilot data available.
Moderate catalog (100-500 products). Product quality: 25%. Low product value ($10-25 avg).
Traffic Sources
Top Countries
Analysis
Weaknesses
- Revenue performance needs improvement
- Traffic and growth metrics are below average
- Trustpilot rating and review volume need improvement
Recommendations
- Focus on increasing AOV, improving conversion rates, and expanding product lines
- Invest in SEO, content marketing, and social media to drive more traffic
- Encourage customer reviews, respond to feedback, and improve customer service
- Consider a comprehensive business review to identify key improvement areas.
Shopify Theme
Simple
by Shopify
Dropshipping Detection
Likely dropshipping (100% confidence)
- • Suspicious pricing patterns
- • No blog content found
- • No About page found
- • No social media presence
Top Keywords
Similar Stores
Stores with similar vertical, industry, or rating to atkinsondesigns.com
| Store | Rating | Vertical | Traffic/yr | Revenue/mo | |
|---|---|---|---|---|---|
| Apolis apolisglobal.com | C44 | Accessories | 98.3K | $16.2K - $37.7K/mo | |
| Majescats majescats.de | C44 | Accessories | 855.6K | $17.3K - $40.4K/mo | |
| Weevil OutdoorFind People on LinkedIn weeviloutdoor.com | C44 | Accessories | 139.5K | $12.4K - $28.9K/mo | |
| Longboi & CoFind People on LinkedIn longboi.co | C44 | Accessories | 142.0K | $13.0K - $30.2K/mo | |
| The Hat Store thehatstore.com.au | C42 | Accessories | 551.5K | $22.1K - $51.6K/mo | |
| uppercaseFind People on LinkedIn uppercase.co.in | C41 | Accessories | 2.7M | $10.9K - $25.5K/mo |
apolisglobal.com
majescats.de
weeviloutdoor.com
longboi.co
thehatstore.com.au
uppercase.co.in
About This Store Analysis
This page provides comprehensive analytics for atkinsondesigns.com, a Accessories store in the Retail industry. Our EcomScout Rating of D+ (29/100) is based on multiple performance factors including revenue estimates, traffic metrics, customer reviews, and business quality indicators.
Use this data to benchmark your own store, research competitors, or discover successful ecommerce strategies. All metrics are estimates based on publicly available data and our proprietary analysis algorithms.
Data is refreshed regularly. Last updated: November 12, 2025. All information shown is publicly available business data.

