Best Selling Products
 #1
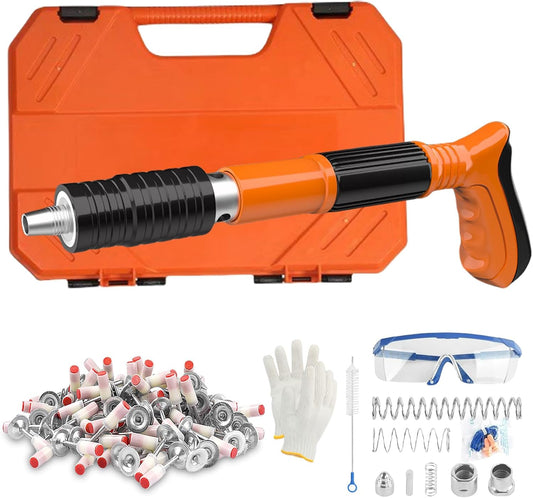
#1Heavy-Duty Concrete Nail Gun Kit with 10 Free Nails 📦 9893 In Stock | 983 Sold 🔥
$4,495.00
#2Heavy-Duty Concrete Nail Gun Kit with 10 Free Nails 📦 9893 In Stock | 983 Sold 🔥
$989
 #3
#3Universal Dual Head Car Fan – 12V Mini Electric 360 Rotatable Cooling Fan | Cheena.PK 📦 9787 In Stock | 227 Sold 🔥
$2,722.50
#4Universal Dual Head Car Fan – 12V Mini Electric 360 Rotatable Cooling Fan | Cheena.PK 📦 9787 In Stock | 227 Sold 🔥
$978
 #5
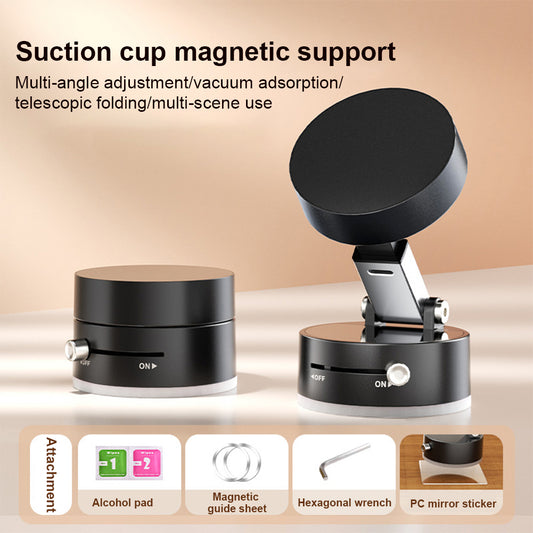
#5Vaccum Magnetic Vlogging Mobile Holder Iphone & Android 📦 998 In Stock | 1 Sold 🔥
$1,295.00
#6Vaccum Magnetic Vlogging Mobile Holder Iphone & Android 📦 998 In Stock | 1 Sold 🔥
$998
 #7
#7Portable Rechargeable Vacuum Cleaner 📦 5 In Stock | 116 Sold 🔥
$3,602.50
#8Portable Rechargeable Vacuum Cleaner 📦 5 In Stock | 116 Sold 🔥
$5
 #9
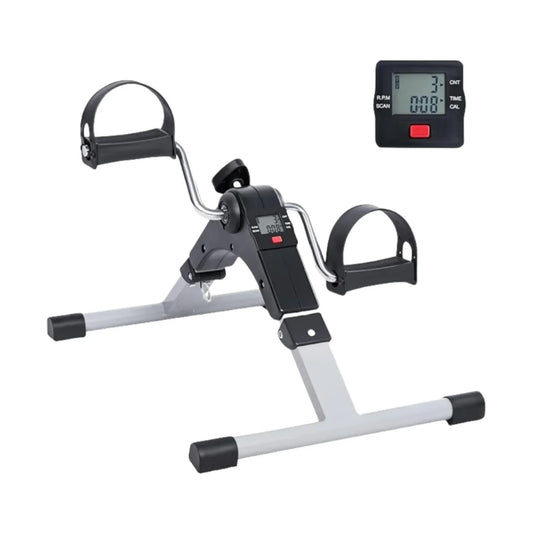
#9Bicycle Cycling Stepper Arm Leg Pedal Exerciser Bicycle Indoor Mini Fitness Exercise Bike Treadmill 📦 In Stock | Sold 🔥
$6,995.00
 #10
#10Digital Exercise Cycle with Free Forearm Strengthener | Cheena.pk 📦 In Stock | Sold 🔥
$6,185.00
Showing top 10 of 40 best sellers
Range: $1 - $999
Rating Breakdown
Very strong revenue ($200K-500K/month). Strong performance vs Media peers (+20 points). No growth data available. Moderate AOV ($40-75).
High traffic (1M-2M visits/year). No traffic growth data available. Good conversion rate (2-3%).
Dropshipping detected (penalty: -4 points). Unknown category.
No Trustpilot data available.
Moderate catalog (100-500 products). Product quality: 25%. High-value products ($100+ avg).
Traffic Sources
Top Countries
Analysis
Weaknesses
- Trustpilot rating and review volume need improvement
Recommendations
- Encourage customer reviews, respond to feedback, and improve customer service
Dropshipping Detection
Likely dropshipping (70% confidence)
- • Duplicate product images detected
- • No blog content found
- • No About page found
- • No social media presence
Top Keywords
Tech Stack & Apps
Analytics
E-commerce Platform
Advertising
Reviews
CDN
Pre-Order
Forms
Product Recommendations
Countdown
Similar Stores
Stores with similar vertical, industry, or rating to Cheena.PK
| Store | Rating | Vertical | Traffic/yr | Revenue/mo | |
|---|---|---|---|---|---|
| Mostly Music mostlymusic.com | B+70 | Media | 2.8M | $798.3K - $1.9M/mo | |
| Frankies Bikinis frankiesbikinis.com | B+69 | Media | 5.8M | $423.6K - $988.4K/mo | |
| iScooter Global Electric ScooterFind People on LinkedIn www.iscooterglobal.co.uk | B+66 | Media | 1.5M | $227.5K - $530.8K/mo | |
| IGN.COM store.ign.com | B+65 | Media | 4.3M | $376.1K - $877.5K/mo | |
| Viral Ecom AdzFind People on LinkedIn viralecomadz.com | B+65 | Media | 580.9K | $128.3K - $299.3K/mo | |
| deineTorte.de votregateau.fr | B60 | Media | 530.2K | $369.2K - $861.4K/mo |
mostlymusic.com
frankiesbikinis.com
www.iscooterglobal.co.uk
store.ign.com
viralecomadz.com
votregateau.fr
About This Store Analysis
This page provides comprehensive analytics for Cheena.PK, a Media store in the Digital industry. Our EcomScout Rating of B (61/100) is based on multiple performance factors including revenue estimates, traffic metrics, customer reviews, and business quality indicators.
Use this data to benchmark your own store, research competitors, or discover successful ecommerce strategies. All metrics are estimates based on publicly available data and our proprietary analysis algorithms.
Data is refreshed regularly. Last updated: December 3, 2025. All information shown is publicly available business data.

