Best Selling Products
Country/region
$1
 #2
#2SHOP ALL
$169.95
#3SHOP ALL
$3
 #4
#4Sort by:
$169.95
 #5
#5MagLock Air Hose
$31.80
 #6
#6Fluid Containment Bottle 32oz & 64oz
$129.95
#7Fluid Containment Bottle 32oz & 64oz
$32
 #8
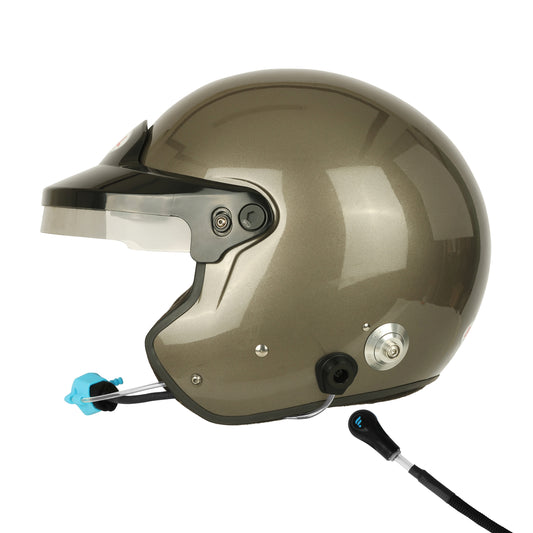
#8S&B Helmet Separator Adapter w/ 6ft Air Hose
$49.95
#9S&B Helmet Separator Adapter w/ 6ft Air Hose
$6
 #10
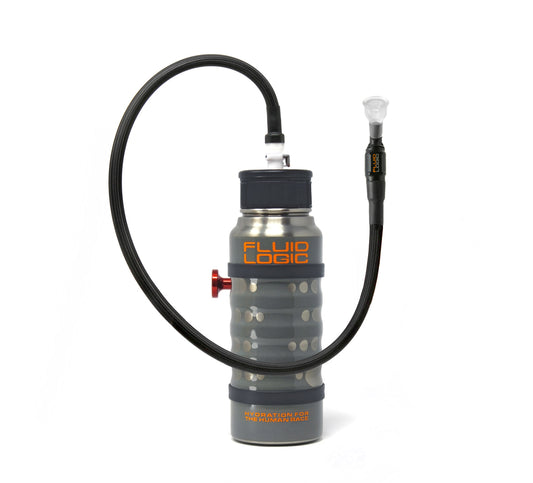
#10FluidLogic Hydro Assembly
$249.95
Showing top 10 of 26 best sellers
Range: $0 - $979
Rating Breakdown
Traffic Sources
Trustpilot Rating
0 reviews
Aggregated rating data only. Individual reviews not displayed for privacy compliance.
Top Countries
Shopify Theme
PRODUCTION
Dropshipping Detection
Likely dropshipping (70% confidence)
- • Duplicate product images detected
- • No blog content found
- • No About page found
- • No social media presence
Top Keywords
Tech Stack & Apps
Analytics and Tracking
Widgets
eCommerce
Frameworks
Mobile
Content Delivery Network
Payment
Content Management System
JavaScript Libraries and Functions
Similar Stores
Stores with similar vertical, industry, or rating to fluidlogic.com
| Store | Rating | Vertical | Traffic/yr | Revenue/mo | |
|---|---|---|---|---|---|
| Ardkeen Quality Food Store www.ardkeen.com | B+42 | Groceries | 381.6K | $11.0K - $25.7K/mo | |
| fuelmeals www.fuelmeals.com | B+40 | Groceries | 1.0M | $133.6K - $311.7K/mo | |
| Paddie Nails trypaddie.com | B+40 | Groceries | 95.7K | $4.5K - $10.6K/mo | |
| Manscaped LLCFind People on LinkedIn checkout.manscaped.com | B+40 | Groceries | 1.6M | $292.6K - $682.7K/mo | |
| Happy V happyv.com | B+40 | Groceries | 973.8K | $31.4K - $73.3K/mo | |
| Zoff Foods zofffoods.com | B37 | Groceries | 565.8K | $64.1K - $149.5K/mo |
www.ardkeen.com
www.fuelmeals.com
trypaddie.com
checkout.manscaped.com
happyv.com
zofffoods.com
About This Store Analysis
This page provides comprehensive analytics for fluidlogic.com, a Groceries store in the Food & Beverage industry. Our EcomScout Rating of C+ (27/100) is based on multiple performance factors including revenue estimates, traffic metrics, customer reviews, and business quality indicators.
Use this data to benchmark your own store, research competitors, or discover successful ecommerce strategies. All metrics are estimates based on publicly available data and our proprietary analysis algorithms.
Data is refreshed regularly. Last updated: December 31, 2025. All information shown is publicly available business data.

