Tea Forte
teaforte.comTea Forté’s gourmet whole leaf teas in our leaf topped pyramid silken infuser define the contemporary tea experience.
Store Preview
Best Selling Products
 #1
#1Tea Chest Tea Tasting Assortment
$78.00
 #2
#2Petite Presentation Box Tea Tasting Assortment
$30.00
 #3
#3Tea Forte SELECT
$55.00
 #4
#4Tea Forte SELECT Tea Chest
$85.00
 #5
#5KATI® Steeping Cup & Infuser Lotus
$26.00
 #6
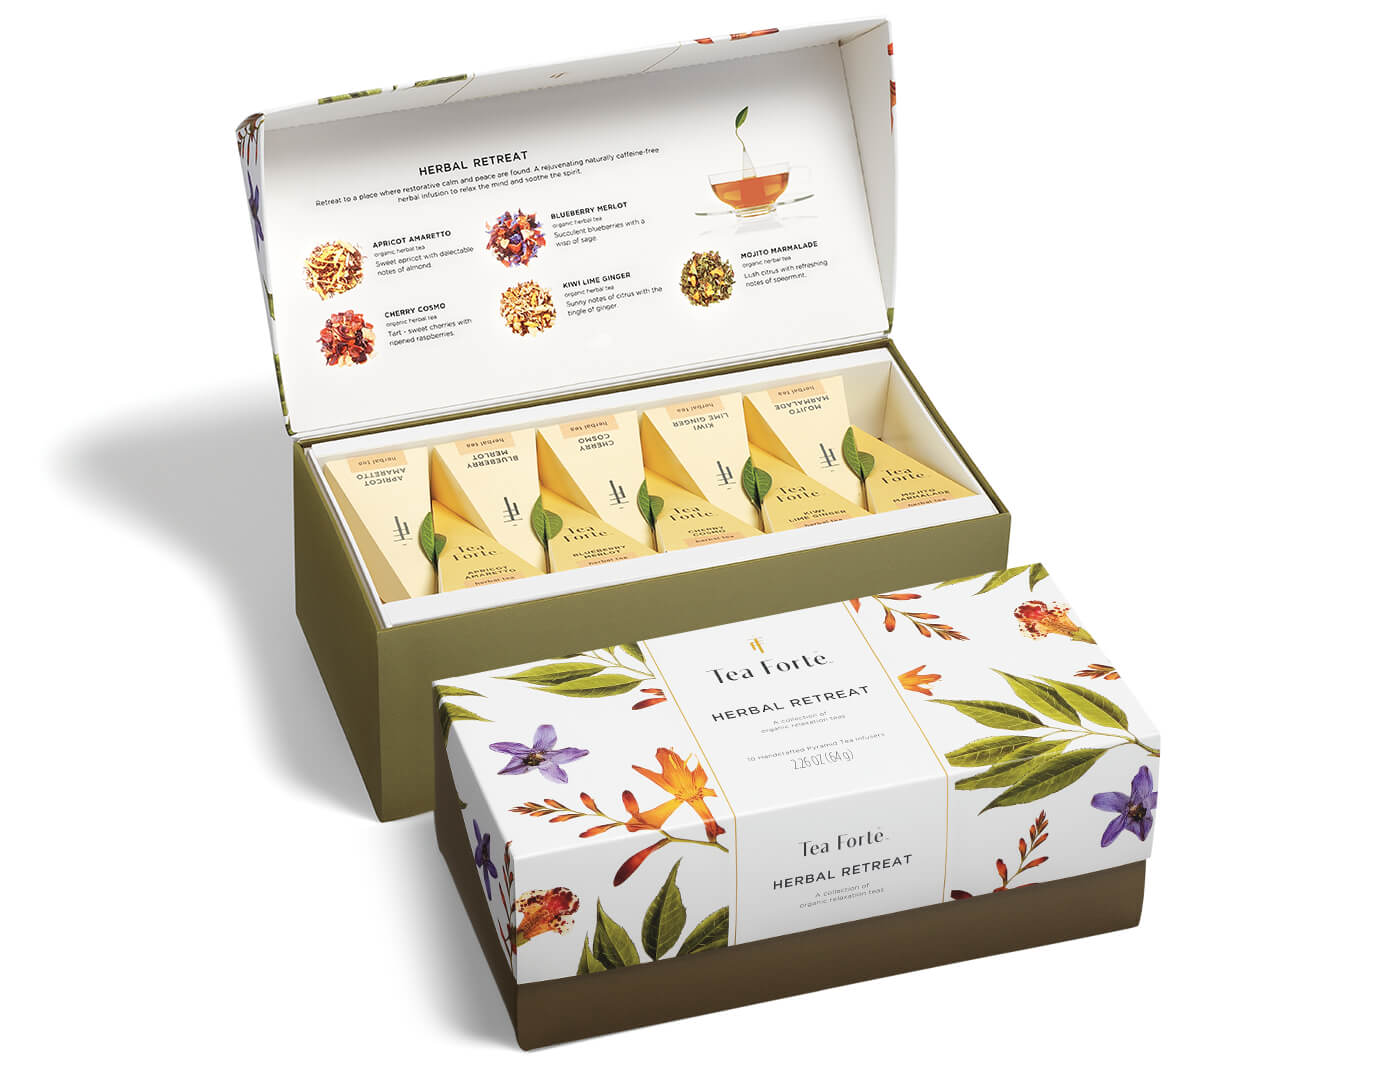
#6Presentation Box Herbal Retreat
$42.00
 #7
#7Presentation Box Tea Tasting Assortment
$40.00
 #8
#8Café Cup Bone White
$25.00
 #9
#9Tea Chest Jubilee
$82.00
 #10
#10Ruby Mini Petite Presentation Box
$15.00
Showing top 10 of 100 best sellers
Range: $0 - $317
Rating Breakdown
Good revenue ($100K-200K/month). Strong performance vs Beverages peers (+15 points). No growth data available. Low AOV ($20-40).
Very high traffic (2M-5M visits/year). No traffic growth data available. Good conversion rate (2-3%).
Dropshipping detected (penalty: -4 points). Unknown category.
Below average rating (3.0-3.5 stars). Minimal review volume (<10 reviews).
Moderate catalog (100-500 products). Product quality: 25%. Moderate product value ($25-50 avg).
Traffic Sources
Trustpilot Rating
1 reviews
Aggregated rating data only. Individual reviews not displayed for privacy compliance.
Top Countries
Shopify Theme
120825_HOL30_GWPCC100
Dropshipping Detection
Likely dropshipping (70% confidence)
- • Suspicious pricing patterns
- • No blog content found
- • No About page found
- • No social media presence
Top Keywords
Tech Stack & Apps
E-commerce Platform
Reviews
Search
Sales Channels
Email Marketing
Subscriptions
Payment
Product Recommendations
CDN
Similar Stores
Stores with similar vertical, industry, or rating to Tea Forte
| Store | Rating | Vertical | Traffic/yr | Revenue/mo | |
|---|---|---|---|---|---|
| OUTIN.COM outin.com | B+72 | Beverages | 3.5M | $654.5K - $1.5M/mo | |
| Suta suta.in | B+70 | Beverages | 5.3M | $931.8K - $2.2M/mo | |
| Dr. Squatch www.drsquatch.com | B+70 | Beverages | 36.0M | $315.0K - $735.1K/mo | |
| Four Sigmatic us.foursigmatic.com | B+67 | Beverages | 2.2M | $1.4M - $3.2M/mo | |
| Good ProteinFind People on LinkedIn goodprotein.ca | B+67 | Beverages | 3.7M | $254.1K - $592.9K/mo | |
| TabsFind People on LinkedIn tabs.co | B64 | Beverages | 3.4M | $130.3K - $303.9K/mo |
outin.com
suta.in
www.drsquatch.com
us.foursigmatic.com
goodprotein.ca
tabs.co
About This Store Analysis
This page provides comprehensive analytics for Tea Forte, a Beverages store in the Food & Beverage industry. Our EcomScout Rating of B (59/100) is based on multiple performance factors including revenue estimates, traffic metrics, customer reviews, and business quality indicators.
Use this data to benchmark your own store, research competitors, or discover successful ecommerce strategies. All metrics are estimates based on publicly available data and our proprietary analysis algorithms.
Data is refreshed regularly. Last updated: December 12, 2025. All information shown is publicly available business data.

