Best Selling Products
 #1
#1Shop Our Bestsellers
$15.00
 #2
#2Gingerbread House Kit
$65.00
 #3
#3Wheel of Fortune Advent Calendar
$45.00
 #4
#4Bone Appétit Bundle
$35.00
 #5
#5Trending
$15.00
 #6
#6Trending
$15.00
 #7
#7Gingerbread House Kit
$65.00
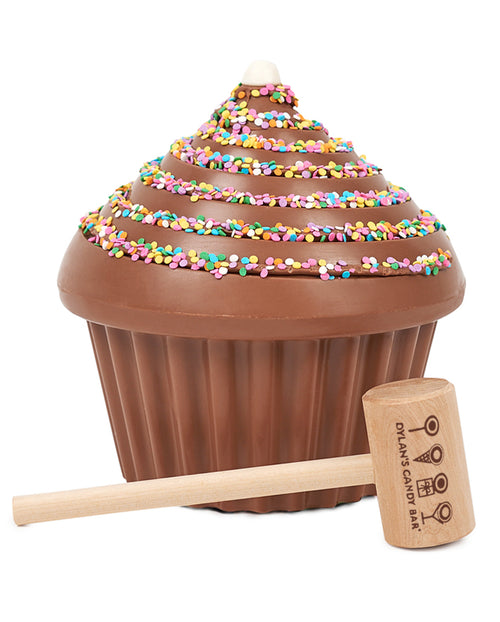 #8
#8BashCake®
$65.00
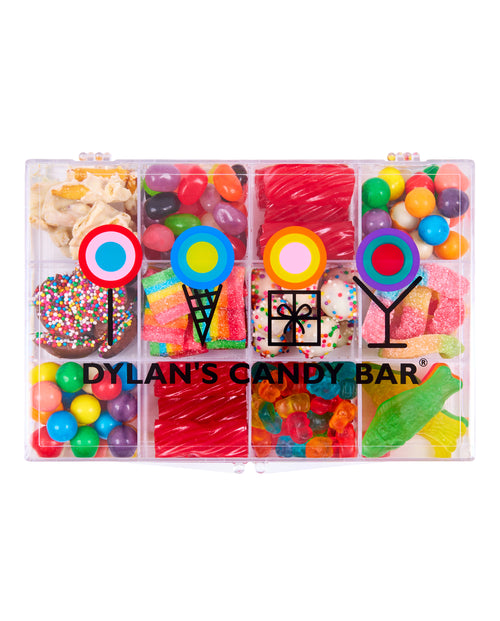 #9
#9Signature Sampler Tackle Box
$28.00
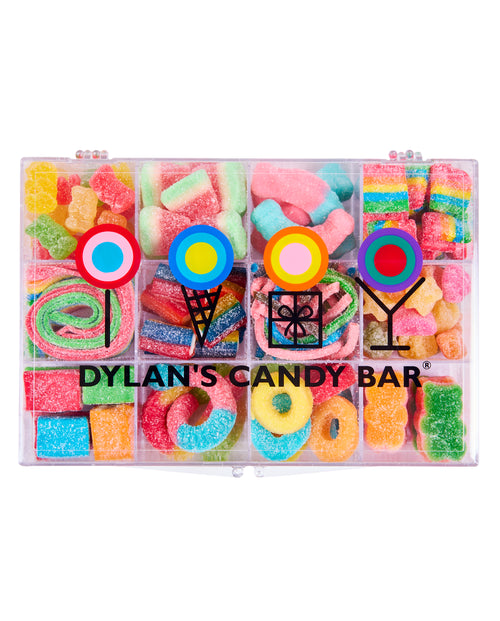 #10
#10Sour Lovers Tackle Box
$28.00
Showing top 10 of 33 best sellers
Range: $0 - $175
Rating Breakdown
Moderate revenue ($50K-100K/month). Strong performance vs Snacks peers (+15 points). No growth data available. Low AOV ($20-40).
Good traffic (500K-1M visits/year). No traffic growth data available. Good conversion rate (2-3%).
Dropshipping detected (penalty: -4 points). Unknown category.
Average rating (3.5-4.0 stars). Minimal review volume (<10 reviews).
Moderate catalog (100-500 products). Product quality: 25%. Moderate product value ($25-50 avg).
Traffic Sources
Trustpilot Rating
7 reviews
Aggregated rating data only. Individual reviews not displayed for privacy compliance.
Top Countries
Shopify Theme
UPDATED EARLY HOLIDAY 10.13 - 10.16, 10.20
Dropshipping Detection
Likely dropshipping (70% confidence)
- • Suspicious pricing patterns
- • No blog content found
- • No About page found
- • No social media presence
Top Keywords
Tech Stack & Apps
Analytics and Tracking
Widgets
Language
eCommerce
Frameworks
Content Delivery Network
Mobile
Payment
Audio / Video Media
Similar Stores
Stores with similar vertical, industry, or rating to Dylan's Candy Bar
| Store | Rating | Vertical | Traffic/yr | Revenue/mo | |
|---|---|---|---|---|---|
| Eric FlagFind People on LinkedIn ericflag.com | B+69 | Snacks | 2.6M | $273.1K - $637.3K/mo | |
| Oats OvernightFind People on LinkedIn www.oatsovernight.com | B+69 | Snacks | 16.1M | $814.7K - $1.9M/mo | |
| afaffaf'a,aafafa,afa,afaffaf-Find People on LinkedIn watts-online.jp | B+69 | Snacks | 8.1M | $1.8M - $4.2M/mo | |
| Alpino alpino.store | B65 | Snacks | 2.5M | $1.1M - $2.5M/mo | |
| Sharbatly Club sharbatly.club | B62 | Snacks | 591.8K | $122.1K - $284.8K/mo | |
| Daily Harvest daily-harvest.com | B62 | Snacks | 1.8M | $91.4K - $213.3K/mo |
ericflag.com
www.oatsovernight.com
watts-online.jp
alpino.store
sharbatly.club
daily-harvest.com
About This Store Analysis
This page provides comprehensive analytics for Dylan's Candy Bar, a Snacks store in the Food & Beverage industry. Our EcomScout Rating of C+ (54/100) is based on multiple performance factors including revenue estimates, traffic metrics, customer reviews, and business quality indicators.
Use this data to benchmark your own store, research competitors, or discover successful ecommerce strategies. All metrics are estimates based on publicly available data and our proprietary analysis algorithms.
Data is refreshed regularly. Last updated: October 16, 2025. All information shown is publicly available business data.

