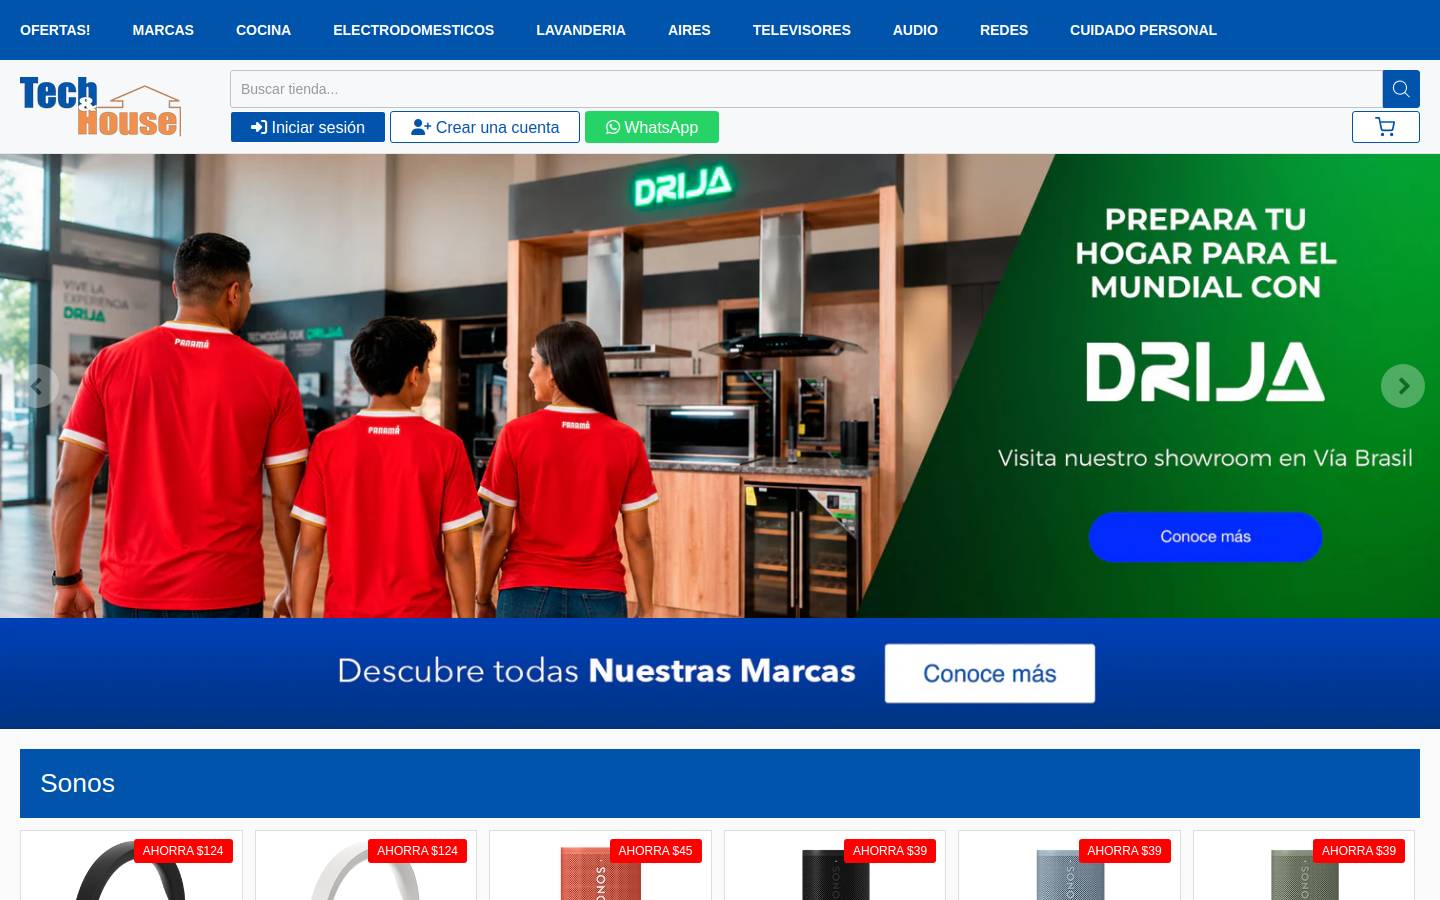
techandhouse.com
techandhouse.comtechandhouse.com receives an EcomScout Rating of B+ (42/100), ranking #31,498 out of 386,762 Shopify stores we track. This Home Appliances Electronics & Tech store attracts 38.4K visits per year with estimated revenue of $20.0K - $49.9K/mo. It offers 2.5K+ products at an average price of $505.
Analysis by EcomScout Research Team · How we calculate ratings
Store Intelligence Summary
Product pricing: Average price of $505 (range: $150 – $2900). Positioned in the premium segment.
0Top markets: US (37%), PA (34%), CO (29%).
Best-selling product: Estufa (Tope) de gas de 60cm | 4 quemadores | Cooktop ($235). Other top sellers include Estufa (Tope) de gas de 76cm | 5 quemadores | Cooktop, Estufa (Tope) de gas de 60cm | 4 quemadores | Cooktop, Refrigeradora Empotrable respirador de frente Glass -B-18FD4AP.
Home Appliances Market Intelligence
Benchmark this competitor against the market
Competition Breakdown
Competitor Research Insights
- •The Home Appliances market generates $1M/month across 48 stores
- •23% are enterprise stores (>$100K/mo) — competitive market
- •Top 10% of Home Appliances stores earn $159K+/month
- •This store outperforms 93% of Home Appliances competitors
- •Low average order value ($0) — consider bundling or upsells
Top Apps in Home Appliances
Best Selling Products
 #1
#1Estufa (Tope) de gas de 60cm | 4 quemadores | Cooktop
$235
 #2
#2Estufa (Tope) de gas de 76cm | 5 quemadores | Cooktop
$337
 #3
#3Estufa (Tope) de gas de 60cm | 4 quemadores | Cooktop
$257
 #4
#4Refrigeradora Empotrable respirador de frente Glass -B-18FD4AP
$1599
 #5
#5Refrigeradora Empotrable respirador de frente Glass -B-18CD4AP
$1369
 #6
#6Cafetera especial Ninja™ con jarra de vidrio
$179.99
 #7
#7Sistema de barista para café y espresso Ninja
$249.99
 #8
#8Licuadora de prensado en frío NeverClog, potente licuadora de prensado lento con control total de la pulpa.
$149.99
 #9
#9Horno doble 12 en 1 con FlexDoor, FlavorSeal y acabado inteligente, convección superior rápida y freidora de aire inferior,
$399.95
 #10
#10Freidora de aire de vidrio Ninja Crispi 4 en 1 en color verde salvia
$189.95
Range: $150 - $2900
Rating Breakdown
Traffic Sources
Top Countries
Analysis
Strengths
- High business quality and trust indicators
- High-quality product catalog
Weaknesses
- Trustpilot rating and review volume need improvement
- Marketing efficiency and ROI need improvement
Recommendations
- Encourage customer reviews, respond to feedback, and improve customer service
- Improve SEO performance: optimize content, build backlinks, and focus on high-intent keywords
- Consider a comprehensive business review to identify key improvement areas.
Shopify Theme
Tech Stack & Apps
Browse All Apps →Shopify Apps Detected (3)
Similar Stores
View all →Frequently Asked Questions About techandhouse.com
Is techandhouse.com a dropshipping store or a legitimate brand?
Based on our dropshipping detection analysis, techandhouse.com is classified as "Unlikely Dropshipper". This store shows minimal signs of dropshipping based on our policy analysis.
Is techandhouse.com safe to buy from? Is it a scam?
We don't have Trustpilot review data for techandhouse.com. However, our EcomScout rating is B+ (42/100).Always check for secure payment options, return policies, and customer reviews before purchasing.
What is techandhouse.com's EcomScout rating and what does it mean?
techandhouse.com has an EcomScout rating of B+ (42/100). This Shopify store rating evaluates performance across revenue estimates, traffic volume, customer reviews, and business quality. Use this data to benchmark against your own Shopify store.
How much traffic and revenue does techandhouse.com generate?
techandhouse.com receives approximately 38.4K visits per year with estimated monthly revenue of $20.0K - $49.9K/mo. These Shopify store analytics are estimates based on SimilarWeb data and our proprietary algorithms.
What Shopify apps and theme does techandhouse.com use?
We detected 3 Shopify apps on techandhouse.com, including Upper header, Lower header, Body inner.Use our Shopify spy tool to discover which apps drive successful stores.
How can I use this Home Appliances store data for competitor research?
This Shopify competitor analysis helps you benchmark your store against techandhouse.com. Study their traffic sources, pricing strategy, best-selling products, and tech stack. As a Home Appliances store, compare their performance metrics to similar stores in your niche.Install our Chrome extension to spy on any Shopify store while browsing.